ADR% is a stock’s average daily range as a share of its price: a stock with a 5% ADR moves about 5% from low to high on a normal day. Momentum traders often screen out anything under 3% to 5%. A chart shared on X on October 13 made the case with 818 trades: about a quarter won in every ADR bucket, while the peak gain grew from +6% under 3% ADR to +31% over 8%, and the gain at the exit from +1.2% to +7.6%. We ran the same cut on our own price history.
The test
- US stocks at $10 or more, trading at least $20 million a day, from January 2022 to September 2026.
- The setup: a stock in the top tenth of the market by relative strength, up 25% or more over three months, within 25% of its 52-week high, above a rising 20-day average and its 10-day, after five sessions in a range no wider than 2.5 times its ADR.
- Only while IWM’s 10-day average sat above a rising 20-day average.
- The buy: the next session, at the five-day high when price traded through it, skipped when the stock opened more than one ADR above it.
- The stop: the five-day low, or one ADR under the entry if that was closer. The exit: the stop, or the first close below the 20-day average from the second session.
- Each trade on its own, one at a time per stock, with 0.2% for costs. Daily bars; on the entry day a low at the stop counts as stopped.
What held
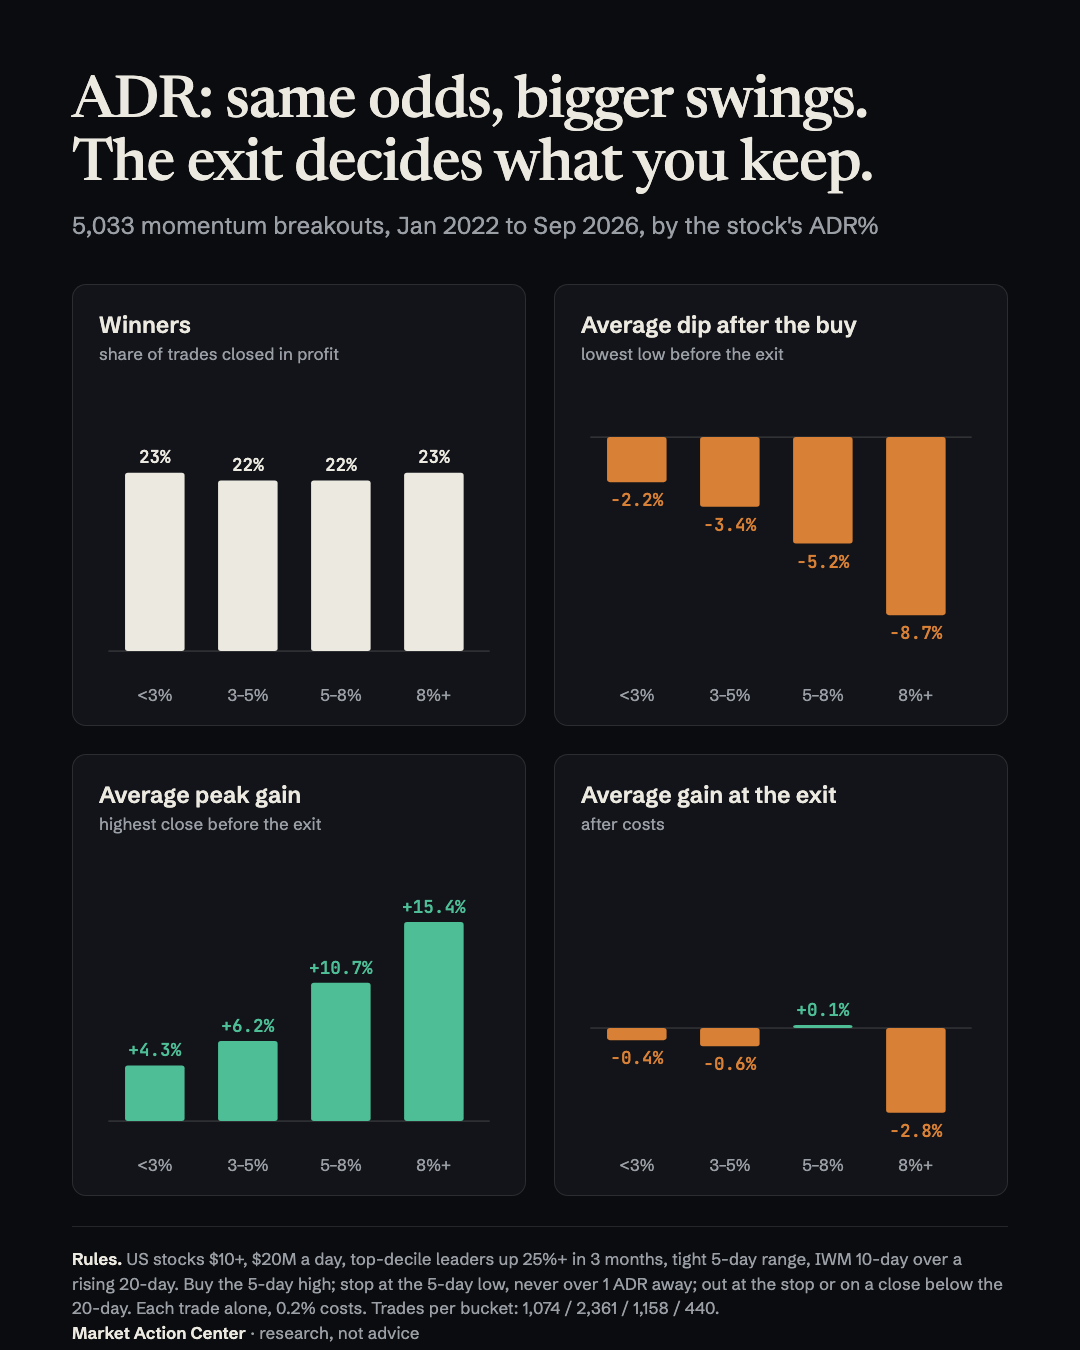
The share of winners did not move with ADR: 22% to 23% in every bucket. The swings did. The average dip after the buy grew from 2.2% to 8.7%, and the average peak gain from +4.3% to +15.4%. The fastest stocks gave the largest moves, as the original chart says.
| ADR% | Trades | Winners | Median stop | Avg dip | Avg peak | Avg at exit | Mean R |
|---|---|---|---|---|---|---|---|
| Under 3% | 1,074 | 23% | 2.6% | −2.2% | +4.3% | −0.4% | −0.14 |
| 3% to 5% | 2,361 | 22% | 3.9% | −3.4% | +6.2% | −0.6% | −0.14 |
| 5% to 8% | 1,158 | 22% | 6.0% | −5.2% | +10.7% | +0.1% | 0.00 |
| 8% and over | 440 | 23% | 9.8% | −8.7% | +15.4% | −2.8% | −0.26 |
R is the trade’s result divided by the distance from the entry to the stop, so a full stop-out is about −1R.
What did not
Held until a close below the 20-day average, no bucket made money after costs. The average trade ended between −2.8% and +0.1%, and the fastest stocks did worst: an average peak of +15.4% became an average of −2.8% at the exit. The moves were there. A 20-day exit gave most of them back on the way down, and the faster the stock, the more there was to give back.
Managing the stop
We then held the same trades under other rules for the stop and the exit, each decided at a close for the next session. None turned these breakouts into a positive average.
| Rule, ADR 4% and over | Winners | Mean R, all | Mean R, ADR 8%+ |
|---|---|---|---|
| Close below the 20-day (as charted) | 22% | −0.11 | −0.26 |
| Stop to the entry once 1R up | 17% | −0.11 | −0.25 |
| Stop to the entry once 2R up | 20% | −0.12 | −0.27 |
| Stop under the 3-day low once 1R up | 28% | −0.18 | −0.17 |
| Close below the 10-day | 25% | −0.15 | −0.15 |
| Close below the 10-day for ADR 8%+ only | 23% | −0.10 | −0.15 |
Moving the stop to the entry changed little and cut the share of winners. Trailing the stop under recent lows raised the share of winners and lowered the average. A faster exit helped only the fastest stocks, and only part of the way.
What this says
In this history, ADR set the size of the swing, not the odds. A screen for fast stocks hands you larger moves in both directions; it does not make a breakout pay by itself. Whatever edge a process has comes from what it buys, when the market allows it, and how it exits, and it has to be measured with all three in place.
Limits
One rule set, one market period, daily bars, and a single cost assumption. The original chart did not publish its rules, so the two sets of numbers describe different trades. A result found in past data is a description of that data; it can fail on the next set of trades.
Research, not advice. Past results, real or tested, do not predict future results. Define and test your own rules before risking capital.